Pakistan Trade Dashboard · FY2024–25
The commerce of Pakistan, charted.
$32 billion in exports. $58 billion in imports. One country, two hundred forty million people, and a decade of official trade statistics — turned into charts anyone can read.
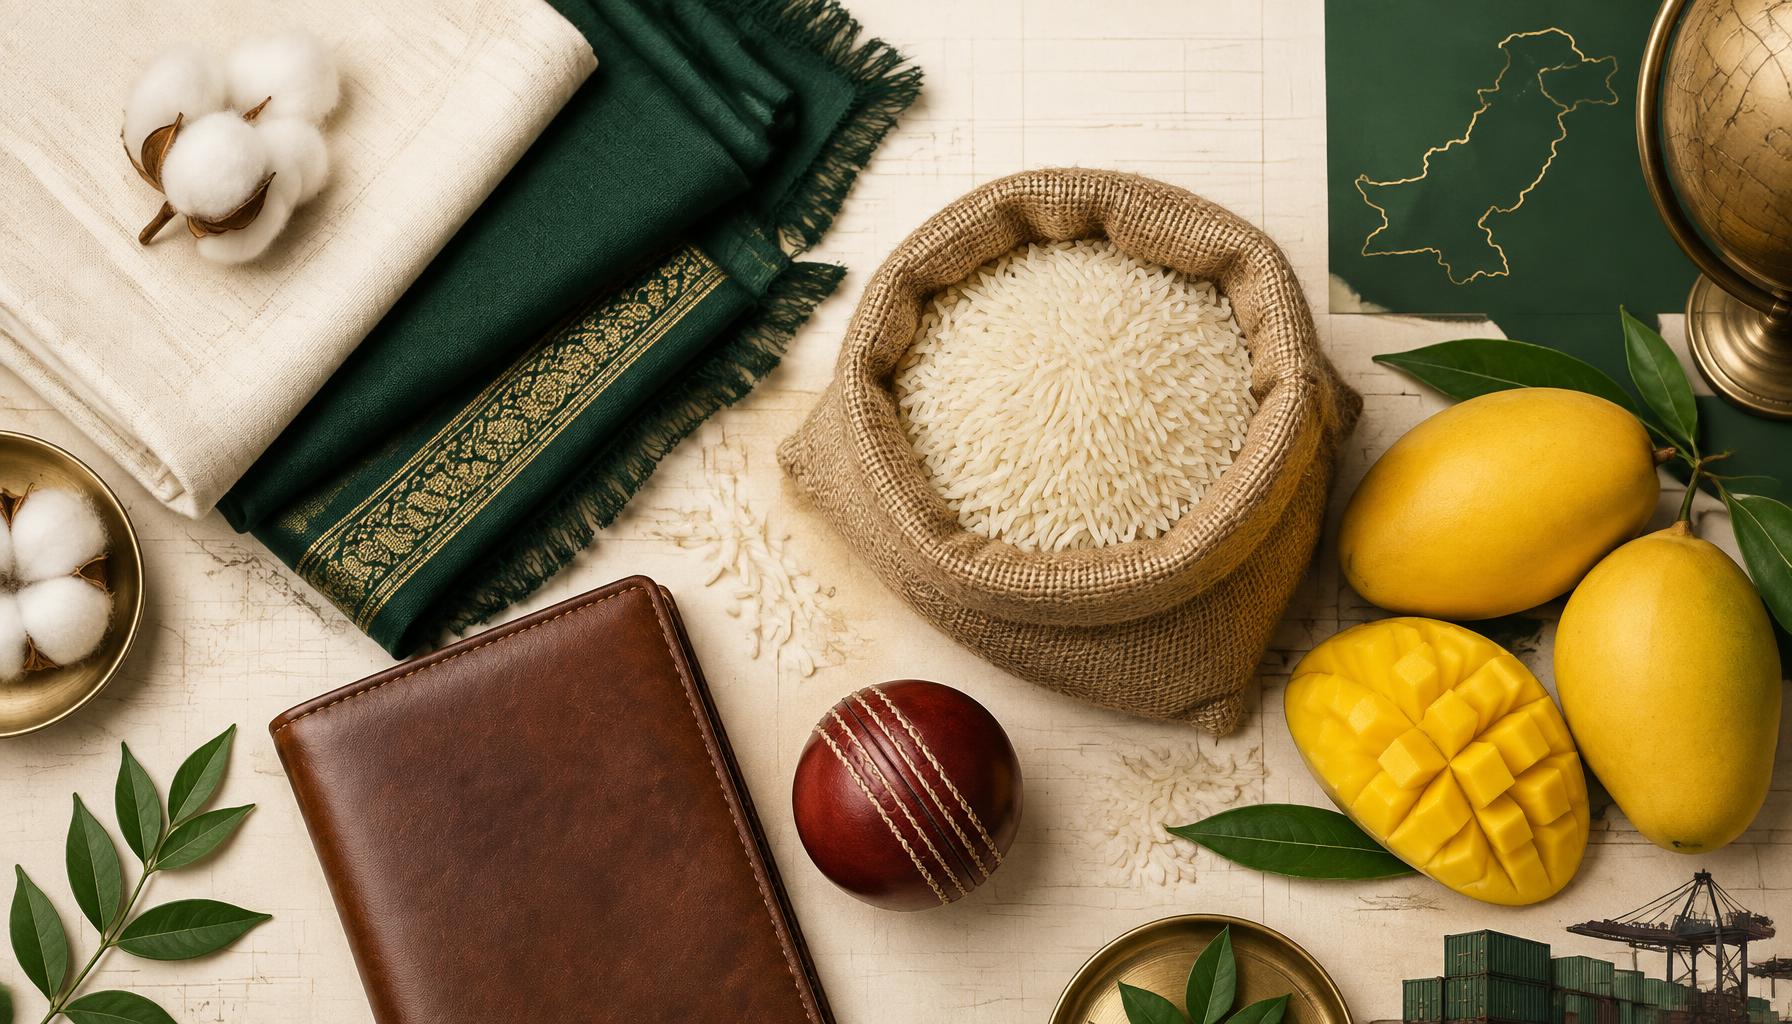
Goods exports
$32.1B
+4.9% vs FY24
FY2024–25, all product groups
Goods imports
$58.4B
+6.8% vs FY24
Led by petroleum & machinery
Trade deficit
$26.3B
+9.0% vs FY24
Imports minus exports
IT & IT-enabled services
$3.8B
+18% vs FY24
Exports of services, record year
Figures compiled from Pakistan Bureau of Statistics and State Bank of Pakistan publications. Provisional and rounded; fiscal years run July–June.
A decade of trade
Exports vs. imports, FY2014–15 to FY2024–25
The gap between the two lines is Pakistan’s trade deficit. It peaked near $41 billion in FY2021–22 when import bills surged, then narrowed sharply as controls tightened — and exports reached a record $32.1 billion in FY2024–25.
Dig deeper
Exports
What Pakistan sells to the world
Textiles, rice, IT services — ranked by value, with the stories behind the numbers.
View →Imports
What Pakistan buys from the world
The energy bill, machinery, and food imports that shape the trade deficit.
View →Partners
Who Pakistan trades with
Top buyers of Pakistani goods and the countries Pakistan imports from most.
View →